Trading Strategies for Crypto Beginners

If
you’re only buying Bitcoin, Ether and other currencies in order to sell
them at a profit a short time later, then the investment is turning
into speculation. You can trade the different tokens on a digital
currency exchange (which are designed for trading fiat money for crypt
currencies) or a crypto currency exchange (crypto for crypto). There are
dozens of different exchanges that we’ll describe in detail in the
guide.
The
approach for speculating is the same as with stocks: you’re buying a
value for money or Bitcoin. The value is stored in your account on the
exchange. Once you have reached your goal, you can sell the tokens.
Hopefully at a profit. There are many strategies, some of which we will present here.
Bitcoin and Nothing Else
You
can buy Bitcoin, store it on a hardware wallet, bury it in your
backyard and retrieve it 10 years later. Maybe you’ll have become rich
by then. Maybe not.
Top 10
This
strategy requires no knowledge and only a little work. You invest 50%
of your capital in Bitcoin and spread the other 50% among the nine next
biggest cryptocurrencies. The site coinmarketcap.com sorts the most
important values according to their market capitalization. As of
February 2018, this order is:
- Bitcoin USD 150 billion
- Ethereum USD 53 billion
- Ripple USD 25billion
- Bitcoin Cash USD 17 billion
- Litecoin USD 9 billion
- Cardano USD 5 billion
- EOS USD 5 billion
- NEO USD 4.5 billion
- Stellar USD 4.4 billion
- IOTA USD 3.6 billion
For
the sake of simplicity, you distribute the second 50% evenly among the
nine following currencies. Then you check them every month or quarter,
sell the currencies that have dropped out of the top 10 and use the
money to buy those that have replaced them.
Advantage: You’re always betting on the winners, spreading the risk and don’t have to pay a lot attention.
Disadvantage: Conservative strategy = lower profits. The more stable the market, the lower the profits.
Only the Best
You
do the work and find out which companies and which business models are
behind every token. Then you select the companies you think will be
successful. You can create segments for that. Is there already a
successful business behind the token or will this only be the case in
the future? Is the token already a market-leader or a latecomer?
As
an example, let’s look at platforms for smart contracts. The market
leaders in descending order are: Ethereum, NEO, Qtum, Lisk, EOS,
OmiseGo. From the present perspective, the most secure option is to
trade Ether.
If
you think the value of the token will increase in the long run, then
you can buy it when the price is lower, sell it when it has increased,
then buy it again on the bottom, and so on. If the value is increasing
in the long run, then you can’t really go wrong with this strategy.
Advantage: the most secure form of speculative trading.
Disadvantage: besides the unpredictability, the evaluation of whether a company is good or not is based on your insight.
LEARN HERE THE BEST ADVANCED STRATEGIES
Utilizing Course Graphs
Look
at the following chart. It shows the course of the coin OmiseGo in
comparison to Bitcoin over a period of four days. You can see that the
course isn’t linear, but wavelike.
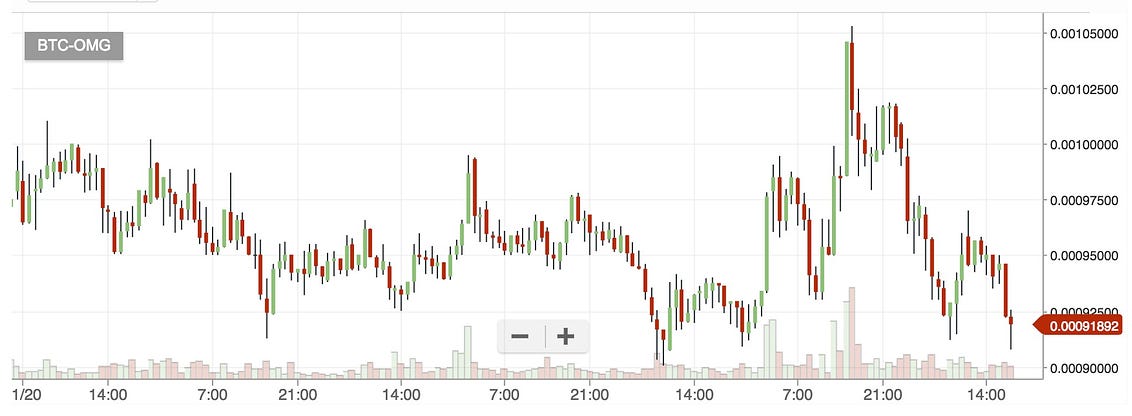
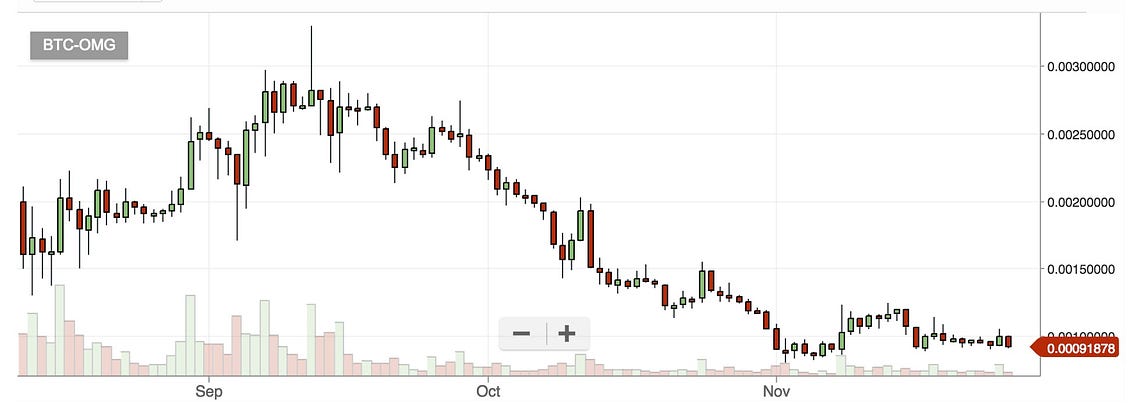
If we increase the timeframe and look at the course over four months, the pattern looks the same: wavelike.
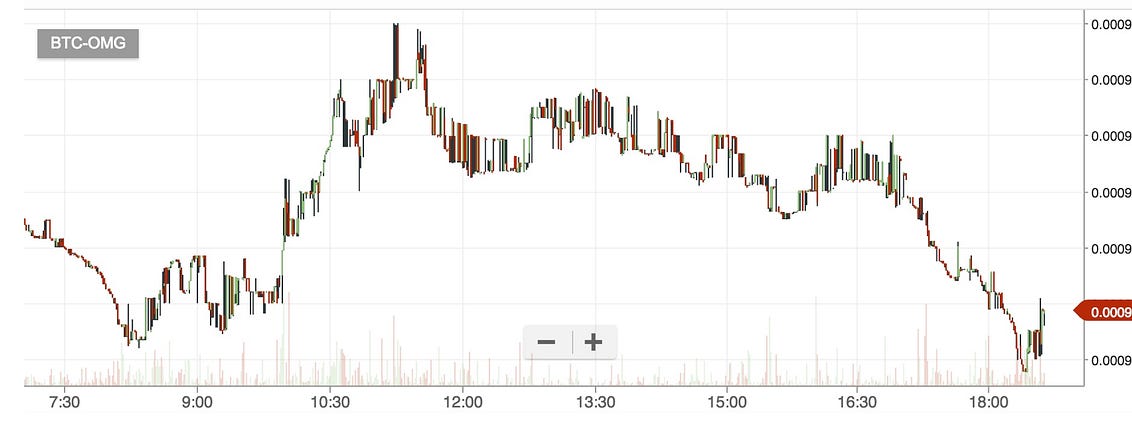
And even if we’re looking at the minute intervals within a single day, the graph takes the same course:
There are only two laws of the market:
1. The price will increase
2. The price will decrease
You
can buy a value in a valley and sell it on a summit. If you’re doing
that with coins you believe in, then you can sometimes also wait a while
if the price doesn’t go up.
Mathematicians
have noticed this arbitrary phenomenon that can be seen on every
market. The have developed algorithms that allow for prognoses about
when a valley or a summit has been reached. Some exchanges let you
display these indicators.
Three of the better-known ones are MACD, RSI and Bollinger Band.
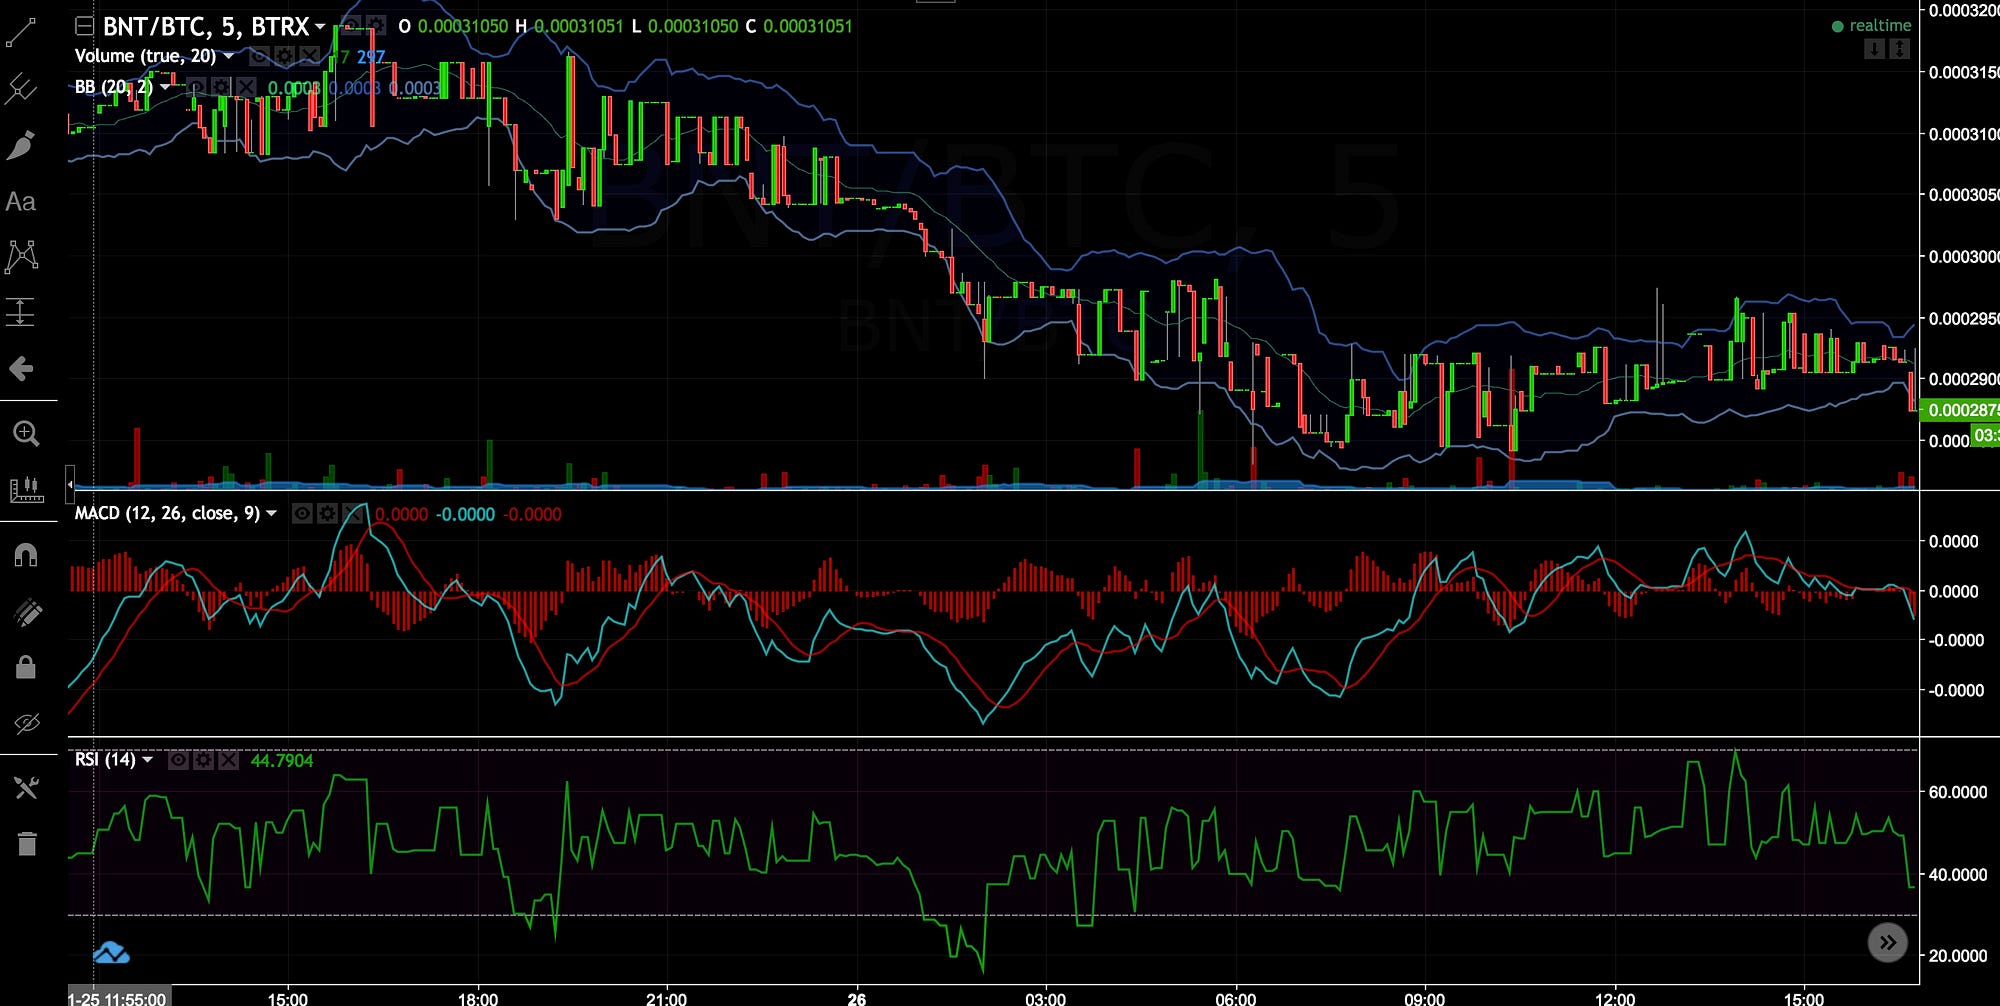
In
this complex chart, you can see the current Bitcoin prices in the upper
third. The green lines indicate a rising price, red lines indicate a
falling price. The thin blue threads above and below the candle-shaped
price indicators are the Bollinger Band. If the candle touches the top,
then the value is “overbought” and will likely fall. If it touches the
bottom, then the value is “oversold” and will likely fall.
You
should combine this with the middle third. It shows the MACD. It’s best
to wait until the MACD (here in turquoise) and the red counter value
are both low, with the turquoise being higher than the red one. A rising
price is expected.
The lower third shows the RSI. If the green line is down and starts to rise again, you can buy.
If all three signals show the same signs, then the probability of there being a trend is higher.
This
is an extremely short explanation. Google the three indicators on the
internet; you will find some good instructions. And you will find
material for analyzing long-term trends.
Whether these indicators are better than reading tea leaves remains to be seen.
Day Trading
Here
you are completely abandoning investing and are now only speculating.
Daytraders use the same technologies we described above. Their
timeframes are simply much shorter. It’s called daytrading because the
positions should be closed by the end of a working day. Some daytraders
sleep badly if they own coins overnight. Who knows what might happen at
night?
Daytraders
try to utilize special short-term course fluctuations. In the crypto
space, this brings them profits between one and three percent. On other
values they lose money. It’s almost a zero-sum game. Allegedly, good day
traders average one to two percent in profit per day. We tried it and
we are evidently worse than the statistical probability.
Pump & Dump
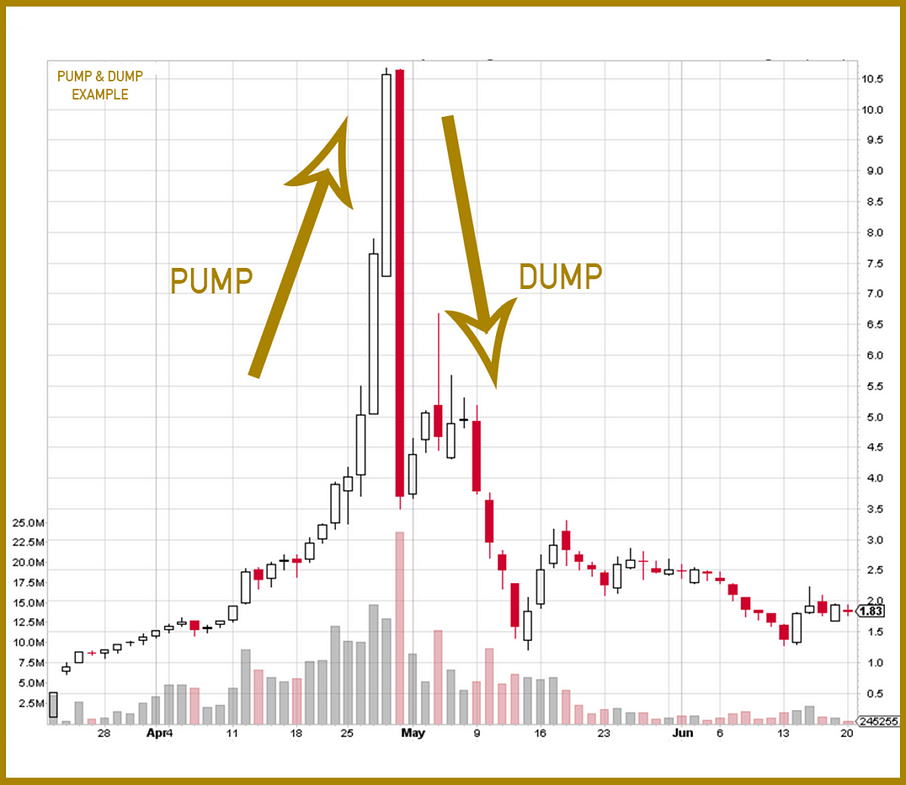
This
is when shady individuals manipulate courses. They meet in groups and
pump money into a value that subsequently rises. Unsuspecting traders
see this rise and invest as well. The price continues to rise within a
very short time frame. Then, the manipulators dump their coins and the
price crashes.
On
the one hand this is illegal and on the other it’s only possible in
markets with low volume. There are many cryptocurrencies where you can
push the course with investments as little as 30,000 euros.
On
average, every small cryptocurrency is becoming the target of a
targeted pump & dump every three months. Within a few minutes, the
price increases by 30 to 1,000 percent and then falls back to the
initial level within seconds. Daytraders can try to spot pumps by
themselves. Or they join illegal groups to find out about the pumps
beforehand.
LEARN HERE THE BEST ADVANCED STRATEGIES
Nessun commento:
Posta un commento